
Water FACTS
We need to reconnect with the value of water and its fundamental role in nearly every action of our daily life, health, and business.
Water in the US
The average American uses 176 gallons of water per day—that’s 64,240 gallons a year.
How is water used in your home? On average, 17% goes toward showering, 27% is used by the toilet, your faucet drains 15%, your clothes washer another 22%, miscellaneous needs take up 5%, and those pesky leaks steal another 14%.
If drinking water and soda pop cost equally, your water bill would skyrocket more than 10,000%.
1,230 gallons of water to yield one beef steak.
2,110 gallons of water to make one pair of shoes.
40,000 gallons of water to make one car (not counting the gas).
19 gallons of water to grow one apple.
32 gallons of water to make one glass of water.
349 billion gallons of freshwater are withdrawn every day in the United States.
Since 2010, the average monthly cost of water has increased by more than 50% in the US.
44 million Americans are served by water systems that violate the Safe Drinking Water Act.
Although lead pipes were banned by Congress 30 years ago, approximately 6.5 million remain in service according to the American Water Works Association.
2.2 million miles of pipes are too old in America.
Water main breaks occur every 2 minutes in the US.
1.4 million Americans have no access to indoor plumbing.
65,000 individuals and 27,000 households lack access to running water in NY.
19% of homes use septic systems that may contribute to contamination.
Perchlorate, a chemical used with explosives, road flares and fireworks that is known to disrupt the thyroid, development of the brain and possibly lead to developmental disabilities and cancer, was found in the water of 33 states and has contaminated the drinking water of at least 20 million Americans.
In 24 major metropolitan areas, at least one pharmaceutical was detected in tests of drinking water supplies from a survey of 62 major water providers.
For instance, the drinking water standard for arsenic, a naturally occurring chemical used in semiconductor manufacturing and treated wood, is at a level where a community could drink perfectly legal water, and roughly one in every 600 residents would likely develop bladder cancer over their lifetimes. That level of exposure is roughly equivalent to the risk the community would face if every person received 1,664 X-rays.
In 2001, lead concentrations in Washington, D.C.’s tap water remained 20-times the federally approved level for three years after the city changed its water disinfection processes.
The water crisis in Flint, Mich., that exposed an estimated 8,000 children to lead and other toxins could amount to almost $400 million in future costs to the city and thousands of cumulative years of poor health for those affected.
The state provided more than $350 million to Flint, in addition to the $100 million from the federal government – all of which is helping with water quality improvements, pipe replacement, healthcare, food resources, educational resources, job training and creation, and more.
19% of households are not served by public sewers and usually depend on septic tanks to treat and dispose of wastewater.
30% of people on the Navajo Nation don’t have running water, and Indigenous populations are 19 times more likely to be living in water poverty than White Americans.
If the planet warms 2 degrees Celsius, Black people are 40 percent more likely than other groups to live in places where extreme temperatures will cause more deaths.
Unless measures are taken, California will demand 3 times more groundwater than can be supplied over the next 100 years.
In 2012, the US spent $102 billion building and updating wastewater treatment plants, $95 billion on installing and repairing sewer pipes, and $48 billion in combined sewer overflow corrections.
The US needs to invest over $1 trillion over 25 years to replace all of its aging drinking water pipes alone.
$3.6 trillion would need to be invested into US infrastructure just to raise the country's support systems to acceptable levels.
Not only do old pipes lose an estimated 18% of the nation’s daily water use and cost $2.6 billion in losses as drinking water pours into the streets, but the leaks also provide entry points for contaminants.
In some cities, 40% of water sent through their systems ends up as non-revenue water that leaks somewhere along the way.
More than a million miles of pipes beneath our streets is nearing the end of its useful life and approaching the age at which it needs to be replaced.
Capital investment needs for the nation’s wastewater and stormwater systems are estimated to total $298 billion over the next 20 years.
22,284—the number of gallons used per day by schools based on an evaluation done of schools in the Tampa Bay region.
The San Antonio Zoo uses approximately 2 million gallons of water a day to care for the animals.
The National Hockey League collectively uses more than 300 million gallons of water each season—it takes 12,500 gallons to make ice for each rink.
61% of Americans rely on lakes, rivers, and streams as their source of drinking water. The other 39% rely on groundwater—water located underground in aquifers and wells.
In the US, 17 million barrels of oil are needed to produce the plastic to meet annual bottled water demand.
The environmental impact of bottled water is up to 3,500 times greater than tap water.
Water rates are up 43% over the last decade, rising faster than any other household utility bill.
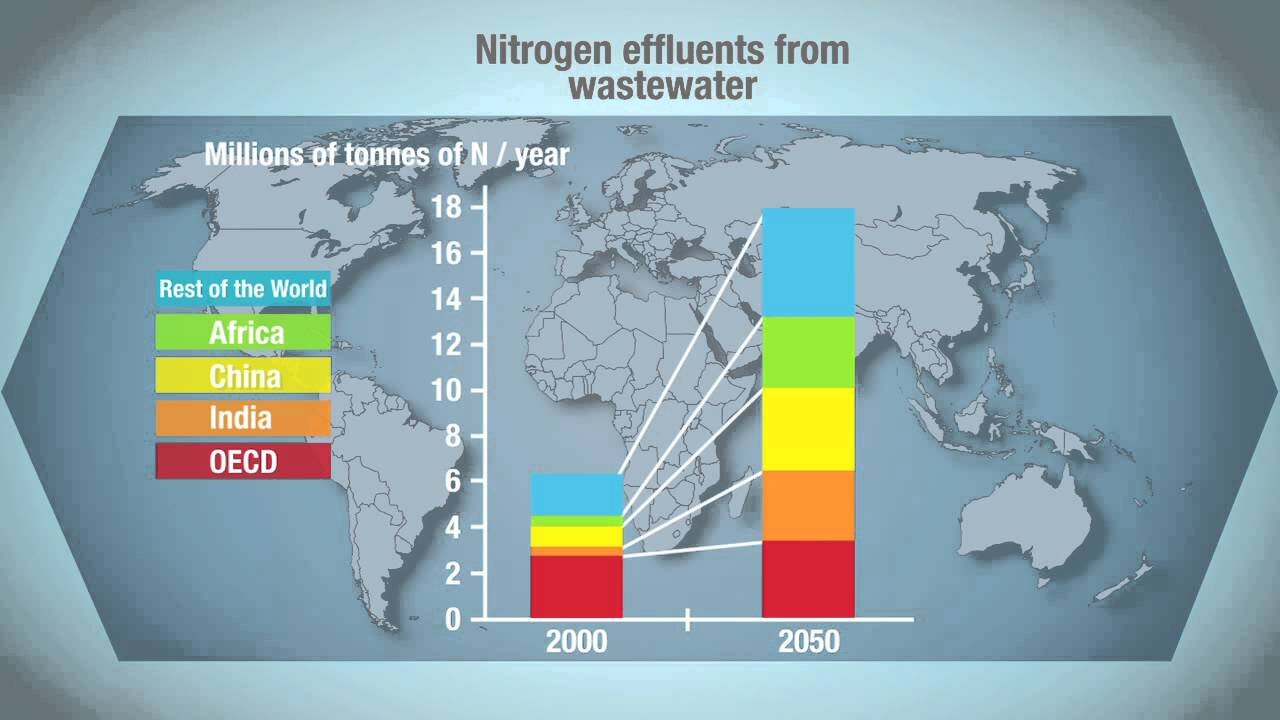
Water, Sanitation, and Hygiene
2.4 billion people lack clean sanitation and hygiene
844 million people lack access to daily drinking water.
6,000 children die each day from water-borne disease and illness
Almost 4 million people die each year from water-related diseases.
At any one time, more than half the world’s poor are ill due to inadequate sanitation, water or hygiene.
443 million school days are lost each year due to water-related illnesses.
A child dies of water-borne diseases about every 15 seconds. By this time tomorrow, another 2,500 will be dead.
80% of untreated wastewater worldwide flows back into the ecosystem, contaminating drinking water for 1.8 billion people.
Globally, at least 2 billion people use a drinking water source contaminated with faeces.
200 million hours each day women and children spend collecting water.
There are still an estimated 240,000 water main breaks per year in the United States, wasting over 2 trillion gallons of treated drinking water
The EPA estimates that 23,000-75,000 sewage overflows occur each year, resulting in the release of up to 10 billion gallons of untreated wastewater into US surface waters.
Ensuring universal access to basic water, sanitation and hygiene (WASH) services offered returns of up to 21 times costs.
75 billion water bottles are sold every year in the US.
Achieving universal access to WASH can yield net benefits of $123 billion per year.
Achieving universal access to WASH can prevent up to 6 billion cases of diarrhea and 12 billion cases of parasitic worms every year.
Water Crisis
90% of all natural disasters are water-related, affecting 2.3 billion people and causing $275 billion in annual damage.
700 million refugees displaced by intense water scarcity by 2030.
$0.29 is the cost to provide water security per day to every person on the planet.
1% investment of global GDP will solve all the world's water challenges.
Water scarcity, exacerbated by climate change, is projected to cost some regions up to 6% of their GDP by 2050.
Overall, annual economic losses from weather-related disasters are estimated at between $ 250 billion and $ 300 billion.
In 2050 increased population will result in a 19% increase in agricultural water consumption.
More than one-third of all counties in the lower 48 states will face higher risks of water shortages by mid-century as a result of global warming.
More than 8 million tons of plastic are dumped in the oceans annually.
In the European Union, 38% of water bodies are significantly under pressure from agricultural pollution.
Water and the Economy
One-fifth of the US economy would grind to a halt without a reliable and clean source of water.
46% of water consumed in America is used to produce the manufacturing products we buy.
40% of water in America is used to produce the food we eat and the beverages we drink.
Every job we create in the water sector helps add another 3.68 jobs in the national economy.
Every $1 spent on infrastructure improvements in the US generates $6.80 in returns.
Agriculture accounts for ~70% of global freshwater withdrawals and up to 90% in some fast-growing economies.
41% or 143 billion gallons of water is used to produce thermoelectric power, making it the largest water use sector in the country.
4% of US energy is used for transporting, treating, and pumping water.
15-megawatt data center can use up to 360,000 gallons of water a day.
Over the past 40 years, the world’s population has doubled and use of water has quadrupled.
By 2030, humanity’s “annual global water requirements” will exceed “current sustainable water supplies” by 40%.
In India alone, water-borne diseases cost the economy 73 million working days per year.
Aquaculture has grown more than 20-fold since the 1980s, especially inland fed aquaculture and particularly in Asia.
The area equipped for irrigation has more than doubled in recent decades.
There will be about 1 billion more mouths to feed worldwide by 2025 and global agriculture alone will require another 1 trillion cubic meters of water per year (equal to the annual flow of 20 Niles or 100 Colorado Rivers).
Together, the drinking water and wastewater sectors predict that the fallout from the pandemic will put them $30 billion in the hole.
2.3 billion gallons of water are used annually by Google in just 3 of their 21 data centers.
In 2018 alone, roughly $38 billion in financial losses were reported by companies as a result of water-related challenges.
Global water demand will increase by 400% from manufacturing by 2050.
In 2019, Google's total water withdrawal was 5.16 billion gallons.
Water demand is projected to grow by 55% by 2050.
By 2035, the world’s energy consumption will increase by 35%, which in turn will increase water use by 15%.
It costs approximately 40% more to replace a failed asset than to address the problem prior to failure.
Every $1 spent on flood prevention could save at least $62 in flood restoration costs.
One in four cities – representing over $4 trillion in economic activity – are already water stressed. This is also true of 70 per cent of the world’s megacities.
If the world continues with business as usual, it’s estimated that 45 cities, each with over three million residents, will face extremely high-water stress by 2030.
66% of listed companies face ocean-related risks and could lose up to $8.4trn in ocean investments over the next 15 years due to declining ocean health and the effects of climate change.
© GRACE Communications Foundation. All Rights Reserved.
Used with permission. www.watercalculator.org
Water Tracker
The following charts summarize progress towards improved water and sanitation access, to realize the United Nations’ Sustainable Development Water Goal 6


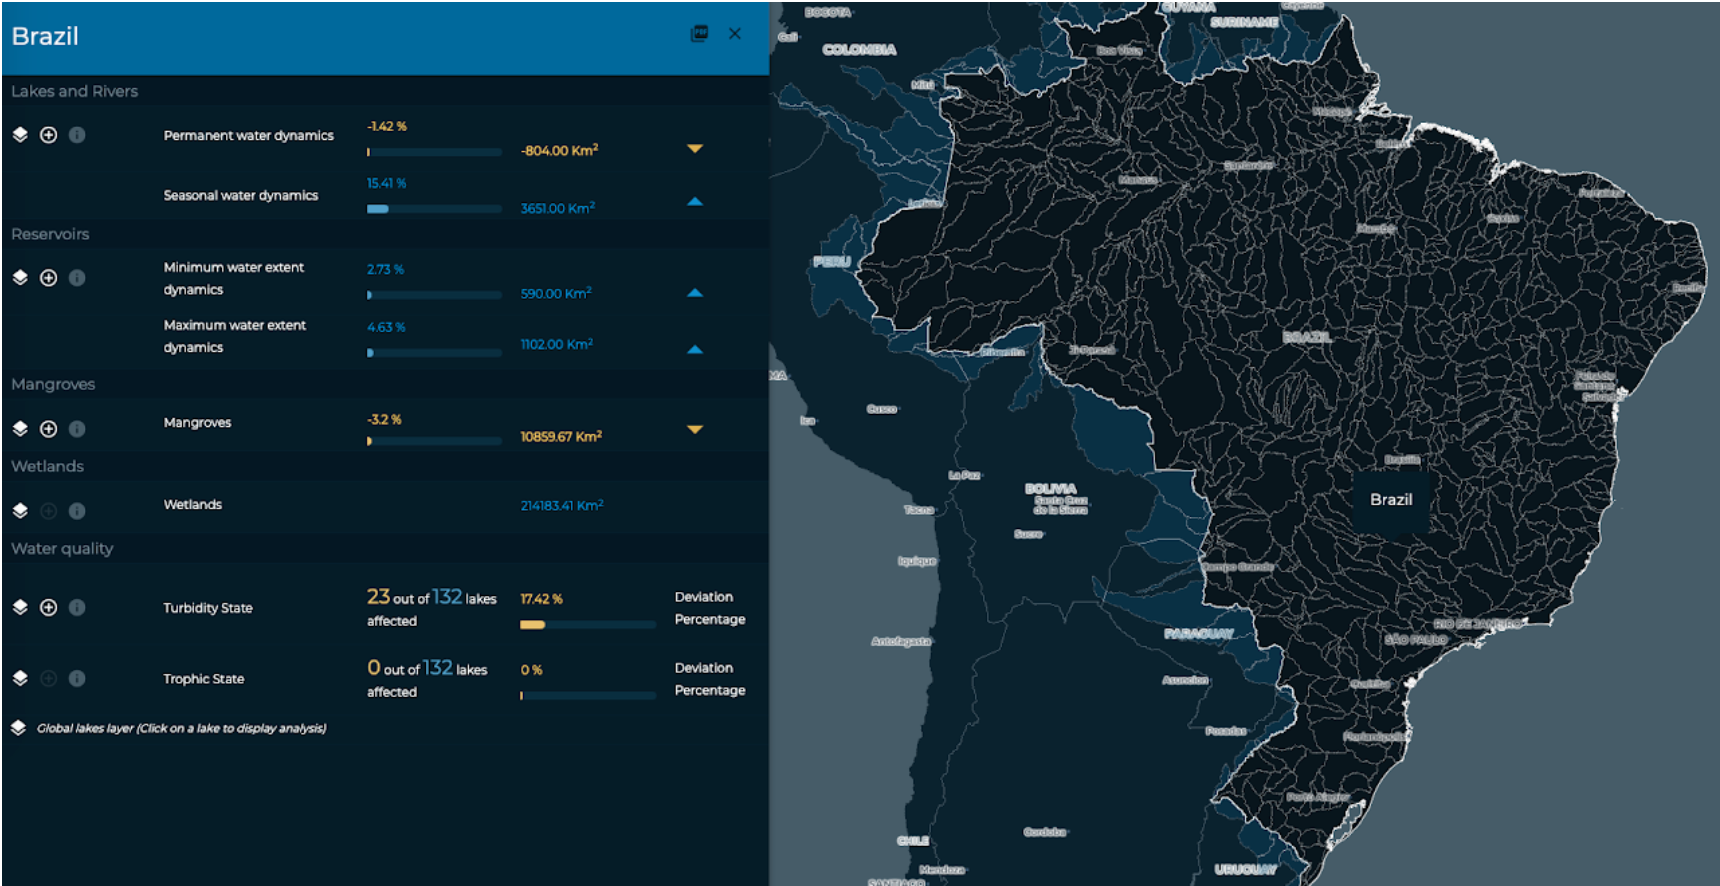
Freshwater Ecosystems Explorer
The Freshwater Ecosystems Explorer is a free and easy to use data platform. It provides accurate, up-to-date, high-resolution geospatial data depicting the extent freshwater ecosystems change over time.
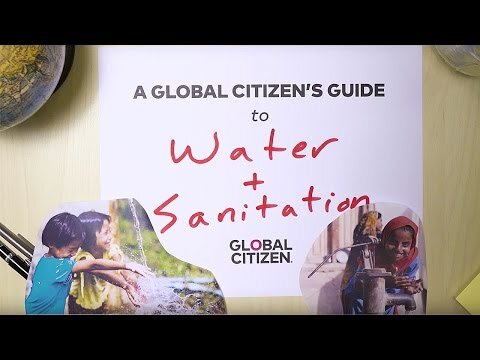
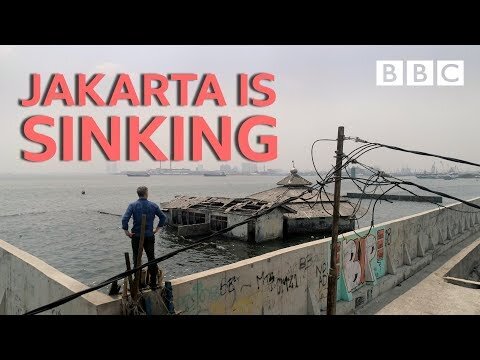
Videos
Learn more about water scarcity, infrastructure, sanitation & hygiene, 'day zero', desalination, land subsidence and the future of water